
Page 8 - Anuario-MKT-2021
P. 8
EN PORTADA
Cuando reCortar es ContraproduCente
Inversión publicitaria 2020 Inversión publicitaria 2020
Inversión publicitaria 2020
Inversión publicitaria 2020
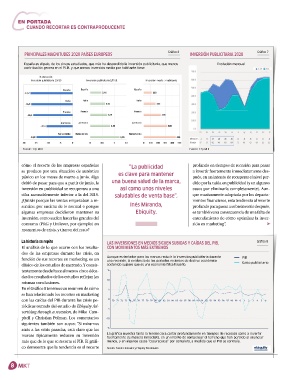
• Los meses de marzo a junio (confinamiento general) representaron el 86% del total caída del mercado
• Los meses de marzo a junio (confinamiento general) representaron el 86% del total caída del mercado
• Los meses de marzo a junio (confinamiento general) representaron el 86% del total caída del mercado
Gráfico 6es de abril tuvo casi la misma inversión que el mes de agosto
publicitario. En concreto, el m • Los meses de marzo a junio (confinamiento general) representaron el 86% del total caída del mercado
Gráfico 7
publicitario. En concreto, el mes de abril tuvo casi la misma inversión que el mes de agosto
publicitario. En concreto, el mes de abril tuvo casi la misma inversión que el mes de agosto
publicitario. En concreto, el mes de abril tuvo casi la misma inversión que el mes de agosto
PrinCiPaleS MaGnitUDeS 2020 PaíSeS eUroPeoS inverSión PUbliCitaria 2020
• Solo el mes de febrero fue ligeramente superior al año anterior, el resto de meses también perdieron inversión
• Solo el mes de febrero fue ligeramente superior al año anterior, el resto de meses también perdieron inversión
• Solo el mes de febrero fue ligeramente superior al año anterior, el resto de meses también perdieron inversión
• Solo el mes de febrero fue ligeramente superior al año anterior, el resto de meses también perdieron inversión
publicitaria pero de manera más suave publicitaria pero de manera más suave
publicitaria pero de manera más suave
WƌŝŶĐŝƉĂůĞƐ ŵĂŐŶŝƚƵĚĞƐ ϮϬϮϬ ƉĂşƐĞƐ ĞƵƌŽƉĞŽƐ
España es el país, de los cincos estudiados, que más ha descendido la inversión publicitaria, que menos publicitaria pero de manera más suave
Evolución mensual
contribución genera en el P.I.b. y que menos inversión media por habitante tiene Evolución mensual Evolución mensual Evolución mensual 2019 2020 2019 2020
Evolución mensual
2019
2020
ƐƉĂŹĂ ĞƐ Ğů ƉĂşƐ͕ ĚĞ ůŽƐ ĐŝŶĐŽƐ ĞƐƚƵĚŝĂĚŽƐ͕ ƋƵĞ ŵĄƐ Ă ĚĞƐĐĞŶĚŝĚŽ ůĂ ŝŶǀĞƌƐŝſŶ ƉƵďůŝĐŝƚĂƌŝĂ͕ ƋƵĞ ŵĞŶŽƐ
•
ĐŽŶƚƌŝďƵĐŝſŶ ŐĞŶĞƌĂ ĞŶ Ğů W͘/͘ ͘ LJ ƋƵĞ ŵĞŶŽƐ ŝŶǀĞƌƐŝſŶ ŵĞĚŝĂ ƉŽƌ ŚĂďŝƚĂŶƚĞ ƚŝĞŶĞ 700,0 700,0 700,0 700,0 2019 2020
й sĂƌŝĂĐŝſŶ
/ŶǀĞƌƐŝſŶ ƉƵďůŝĐŝƚĂƌŝĂ ϮϬͬϭϵ /ŶǀĞƌƐŝſŶ ƉƵďůŝĐŝƚĂƌŝĂ ^ͬW͘/͘ ͘ 600,0 /ŶǀĞƌƐŝſŶ ŵĞĚŝĂ dž ŚĂďŝƚĂŶƚĞ 600,0 600,0 600,0
500,0 500,0 500,0 500,0
ƐƉĂŹĂ ƐƉĂŹĂ ƐƉĂŹĂ
Ͳϭϳ͕Ϯ Ϭ͕ϰϲ ϭϭϯ
400,0 400,0 400,0 400,0
/ƚĂůŝĂ /ƚĂůŝĂ /ƚĂůŝĂ
Ͳϭϲ͕ϵ Ϭ͕ϲϭ 300,0 ϭϲϲ 300,0 300,0 300,0
&ƌĂŶĐŝĂ
&ƌĂŶĐŝĂ &ƌĂŶĐŝĂ 200,0 200,0 200,0 200,0
Ͳϭϲ͕ϭ Ϭ͕ϲϵ Ϯϯϴ
100,0 100,0 100,0100,0
ůĞŵĂŶŝĂ ůĞŵĂŶŝĂ ůĞŵĂŶŝĂ
ͲϭϬ͕ϲ Ϭ͕ϴϮ ϯϮϲ
0,0 0,0 0,0 0,0
Ene Feb Mar Abr May Ene Jun Ene Ene Feb Feb Jul Feb Mar Mar AbrMar Ago Abr Jun Abr Sep Jul Jun Ago May Oct Jul Sep Ago Oct Jun Nov Sep Dic Jul Dic Oct Nov Ago Dic Sep Oct Nov Dic
May
Nov
May
ZĞŝŶŽ hŶŝĚŽ ZĞŝŶŽ hŶŝĚŽ ZĞŝŶŽ hŶŝĚŽ
ϭ͕Ϯϭ
ϰϰϲ
Ͳϭϰ͕ϴ Diferencia (mil €) -8 15 -137 -284 Diferencia (mil €)Diferencia (mil €) -186 -8 -8 15 15 -34 15 -137 -137 -284 -137 -18 -284 -186 -284 -48 -34 -186 -18 -345 -41 -34 -48 -186 -14 -48 -13 -34 -13 -41 -14 -18 -13 -48 -41 -14 -13
-41 -14
-345
-345
-18
Diferencia (mil €) -8
-345
-30,6
-54,0
ϱϬϬ
ͲϮϬ Ͳϭϱ ͲϭϬ Ͳϱ Ϭ Ϭ Ϭ͕ϱ ϭ % Variación -1,7 Ϭ ϭϬϬ 3,3 ϮϬϬ -24,2 ϰϬϬ % Variación -55,3 % Variación -1,7 -1,7 -1,7 3,3 3,3 -7,3 3,3 -24,2 -24,2 -54,0 -24,2 -6,4 -54,0 -30,6 -54,0 -9,0 -7,3 -30,6 -55,3 -9,0 -30, -6,46 -2,2 -2,2 -9,0 -7,3 -2,0 -2,0 -6,4 -2,2 -6,4 -2,0 -9,0 -6,4 -2,2 -2,0
% Variación
-6,4
-55,3
ϭ͕ϱ
-55,3
-6,4 -6,4 -7,3
ϯϬϬ
Viewpoint Fuente: 12p MHL Fuente: 12p MHL
What we can learn “la publicidad profundo en tiempos de recesión para pasar
cómo el recorte de las empresas españolas
se produce por una situación de auténtico
a invertir fuertemente inmediatamente des-
pánico en los meses de marzo a junio. Algo es clave para mantener pués, en un intento de recuperar el nivel per-
from history debió de pasar para que a partir de junio, la una buena salud de la marca, dido por la caída en publicidad (y en algunos
Viewpoint
así como unos niveles
inversión en publicidad se recuperara a una
casos por eliminarla completamente). Aun-
What we can learn
cifra razonablemente inferior a la del 2019. saludables de venta base”. que masivamente adoptada por los departa-
¿Quizás porque las ventas empezaban a re- mentos financieros, esta tendencia al recorte
from history
sentirse por encima de lo normal o porque inés Miranda, profundo para pasar a sobreinvertir después,
they have lost by advertising less – and in some
Although it is tempting for brands to cut ad Looking back over past recessions, it is clear that Ebiquity. es también una consecuencia de una falta de
algunas empresas decidieron mantener su
spend during a recession, the evidence from brands typically reduce their spend more than GDP cases “going dark” completely – as GDP contracted.
entendimiento de cómo optimizar la inver-
inversión, como suelen hacer las grandes del
recent periods of sustained economic decline actually shrinks as a result of a recession. Figure 4. While largely driven by financial forces, this tendency to
➤
consumo (P&G y Unilever, por ejemplo) en
sión en marketing”.
they have lost by advertising less – and in some
Looking back over past recessions, it is clear that
Although it is tempting for brands to cut ad
suggests that it is a false economy to do so. shows both the tendency to cut deep in times of cut deeply, then overinvest later, is also a consequence
momentos de crisis, y tiraron del resto?
brands typically reduce their spend more than GDP
cases “going dark” completely – as GDP contracted.
spend during a recession, the evidence from
recession and invest heavily immediately after a of a misunderstanding of how best to optimise
While largely driven by financial forces, this tendency to
actually shrinks as a result of a recession. Figure 4.
recent periods of sustained economic decline
Indeed, it is so attractive that often companies cannot recession, in attempt to make up for the ground marketing spend. cut deeply, then overinvest later, is also a consequence
shows both the tendency to cut deep in times of
suggests that it is a false economy to do so.
la historia se repite
Gráfico 8
laS inverSioneS en MeDioS SiGUen SUbiDaS y CaíDaS Del Pib,
resist. In a survey published in March 2020 by El análisis de lo que ocurre con los resulta- recession and invest heavily immediately after a of a misunderstanding of how best to optimise
Con MoviMiEntoS MáS ExtREMoS
Indeed, it is so attractive that often companies cannot
Marketing Week, 60% of respondents said they were dos de las empresas durante las crisis, en recession, in attempt to make up for the ground marketing spend.
resist. In a survey published in March 2020 by
delaying or reviewing ad spend commitments for the Figure 4. Media investments follow rises and falls in GDP, with more extreme movements PIb
Aunque es tentador para las marcas reducir la inversión publicitaria durante
GDP
Marketing Week, 60% of respondents said they were
función de sus recortes en marketing, es un
una recesión, la evidencia de los períodos recientes de declive económico
Ad Expenditure
rest of this year in light of the coronavirus pandemic. clásico de los estudios de mercado. Y consis- Figure 4. Media investments follow rises and falls in GDP, with more extreme movements Gasto publicitario
delaying or reviewing ad spend commitments for the
GDP
sostenido sugiere que es una economía falsa hacerlo.
Ad Expenditure
rest of this year in light of the coronavirus pandemic.
55% were delaying campaigns or putting them under 15 tentemente desde hace al menos cinco déca- 15
55% were delaying campaigns or putting them under
review, and the same proportion said they had paused das los resultados de los estudios reflejan las
review, and the same proportion said they had paused
product or service launches. Ebiquity's own client 10 mismas conclusiones. 6 10
product or service launches. Ebiquity's own client
6
data suggests brands may reduce spend by as much
data suggests brands may reduce spend by as much En el Gráfico 8 tenemos un resumen de cómo 5
as ~20% versus what was planned at the start of
as ~20% versus what was planned at the start of 5 se han relacionado los recortes en marketing
the year.
the year. con las caídas del PIB durante las crisis pe- 0 70 71 72 73 74 75 76 77 78 79 80 81 82 83 84 85 86 87 88 89 90 91 92 93 94 95 96 97 98 99 0 1 2 3 4 5 6
0 riódicas tomado del estudio de Ebiquity Ad-
70 71 72 73 74 75 76 77 78 79 80 81 82 83 84 85 86 87 88 89 90 91 92 93 94 95 96 97 98 99 0 1 2 3 4 5 6
-5
vertising through a recession, de Mike Cam-
-5 pbell y Christian Polman. Los comentarios -10
siguientes también son suyos: “Si miramos
atrás a las crisis pasadas, está claro que las -15
-10 6 https://bit.ly/2vQBeMK La gráfica muestra tanto la tendencia a cortar profundamente en tiempos de recesión como a invertir
marcas típicamente reducen su inversión
fuertemente de manera inmediata, en un intento de compensar el terreno que han perdido al anunciar
más que de lo que se recorta el PIB. El gráfi- menos, y en algunos casos “oscurecerse” por completo, a medida que el PIb se contraía. 6
Advertising through a recession.
-15
co demuestra que la tendencia es el recorte Fuentes: Fuentes: Infoadex y Ebiquity Benchmarks
6 https://bit.ly/2vQBeMK
Advertising through a recession. 6
8